|
System Survey Results 2023
The National Litter Pollution Monitoring System has set out to answer 3 key questions:
1. How Littered is the Country at National Level?
Under the system, the extent and severity of litter pollution is measured by using a Litter Pollution Index (LPI), which is a scale of 1 to 5 as described below:
- Unpolluted or litter free
- Slightly polluted
- Moderately polluted
- Significantly polluted
- Grossly polluted
Based on litter pollution surveys carried out by local authorities in 2023, the extent of litter pollution in the surveyed areas is set out in Figure 1 below:
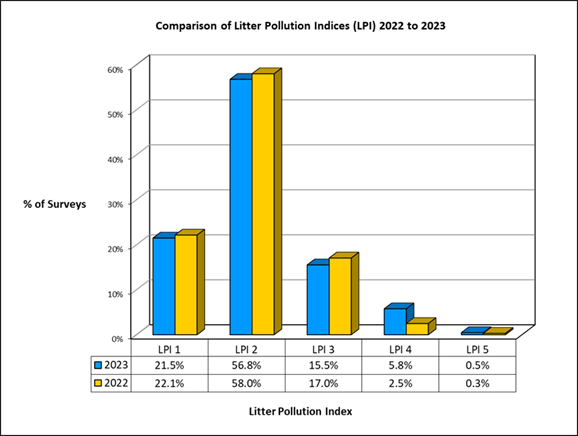
Figure 1 Comparison of Litter Pollution Indices (LPI) 2022 to 2023
The 2023 dataset is obtained from 5718 litter pollution surveys. The NLPMS results indicate that the percentage of unpolluted (LPI 1) areas has decreased from 22.1% in 2022 to 21.5% in 2023. A comparison of the results from 2022 to 2023 indicates that the percentage of slightly polluted (LPI 2) areas has decreased from 58.0% in 2022 to 56.8% in 2023. The percentage of moderately polluted areas (LPI 3) has decreased from 17.0% in 2022 to 15.5% in 2023. The percentage of significantly polluted areas (LPI 4) has increased from 2.5% in 2022 to 5.8% in 2023. Grossly polluted areas (LPI 5) increased by 0.2% from 0.3% in 2022 to 0.5% in 2023.
A key feature of the Litter Pollution Survey is its focus on monitoring in areas that are polluted or are likely to be polluted i.e., where potential sources of litter are located. To this end, local authorities determine the locations for their surveys using maps produced by specially designed Litter GIS software, as follows:
- 40% in “high risk” locations (e.g. in town or city centres) where the concentration of potential litter sources is greatest;
- 40% in random potential litter generating areas - chosen by the Litter GIS software; and
- 20% in locations chosen by local authorities, based on local knowledge of litter pollution.
Accordingly, the national monitoring system is biased towards measuring the nature and extent of litter pollution in those areas most likely to be littered (i.e. largely in urban areas), rather than the country as a whole; it will measure trends in these key indicators over time.
2. What are the Main Constituent Elements of Litter Pollution?
Local authorities also carried out litter quantification surveys (or item counts) to determine the composition of litter in their areas. A breakdown of the main constituents of litter pollution is highlighted in Figure 2 below:
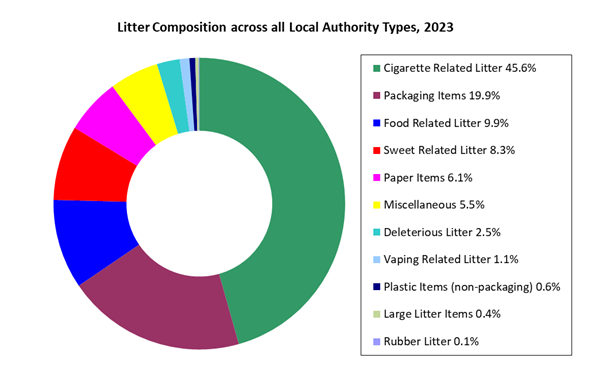
Figure 2 Composition of Litter in 2023 Broken Down into Main Categories
From the data, it can be seen that:
- Cigarette related litter (45.6%) continues to constitute the highest percentage of litter in the locations surveyed this is comprised mainly of cigarette ends which constitute 42.6% % of all litter items nationally.
- Packaging litter (19.9%) is the second largest component of national litter pollution recorded. A number of new litter items were added to this category in 2023 to account for the growing use of Single Use Plastics. Bottle caps (2.3%), bottles (1.7%), beverage cans (non-alcoholic) (1.4%), beverage cans (alcoholic) (1.3%), bags and wrappers (1.2%), drink lids (1%), beverage bottles (alcoholic) (1%) and beverage bottles (non-alcoholic) (1%) and drink cups cold (0.8%) are the main litter items in this category.
- Food related litter (9.9%) is the third largest category of litter pollution recorded. Chewing gum is the single largest litter component in the food related litter category, and the second largest component nationally, comprising 8.6% of all litter recorded in the LQS conducted in 2023.
- Sweet-related litter (8.3%) is the fourth largest category of litter pollution recorded. Sweet wrappers (plastic/foil) (4.5%) are the largest litter component in the sweet-related litter category in 2022 and is the third largest litter component nationally.
A more detailed analysis of the litter pollution and quantification surveys data is available in National Systems Report.
3. What are the Main Causes of Litter Pollution?
The main causative factors of litter pollution identified in the litter pollution surveys, in order of significance, were as follows:
- Passing Pedestrians 42.3%
- Passing Motorists 20.2%
- Retail Outlets 8%
- Gathering Points 6.3%
- Places of Leisure/Entertainment 4.1%
- Fast Food Outlet 4.6%
- Schools/School Children 4.3%
- Bus Stops 3.2%
- Fly-tipping/ Dumping 2.4%
- Bring Bank 1.8%
- Bank/ATM 0.6%
- Bus/Train Station 0.4%
- Refuse Collection/Presentation 0.9%
- Overflowing Bins 0.3%
- Construction Site 0.4%
- Major Entertainment Event 0.3%
NOTES
1. TOBIN Consulting Engineers were appointed by the Minister for the Environment, Heritage and Local Government as the Litter Monitoring Body (LMB) in May 1999 to develop a national litter pollution monitoring system and oversee local authority implementation of it. The main purpose of the monitoring system is to generate, by means of surveys, reliable data to enable each local authority to measure accurately over time changes in the extent and composition of litter pollution in its area, and so provide for more effective litter management planning.
2. In essence, the system requires local authorities to:
i.) identify / map the potential sources of litter in their areas, using Litter GIS software;
ii.) use this data to identify the locations for surveys to determine the composition and extent of litter pollution in their areas;
iii.) carry out “benchmark” surveys;
iv.) carry out further series of surveys annually thereafter, the results of which can be compared to the "benchmark" or previous years’ survey results to measure progress in tackling litter; and,
v.) complete the appropriate forms for the surveys and forward same to the LMB for analysis / assessment.
3. The LMB, on receipt of the survey data from local authorities:
vi.) reports back to each local authority with its assessment of that authority’s survey data; and
vii.) collates the survey results in a national overview and presents it to the Department.
4. There are two types of surveys required
- Litter Pollution surveys to determine the extent and severity of litter pollution.
- Litter Quantification surveys to identify the composition (i.e. the type and origin) of litter pollution prevailing in a particular area.
5. The litter quantification surveys identify nine broad categories of litter:
- cigarette related litter;
- packaging litter (i.e. takeaway, glass, metal, paper, plastic);
- food litter (chewing gum etc.);
- sweet related litter (i.e. sweet wrappers, crisp bags, lolly pop sticks, straws etc.);
- paper litter (e.g. bank slips, bus tickets, newspapers, magazines etc.);
- plastic litter (i.e. non packaging litter i.e. plastic cutlery, toys etc.);
- deleterious litter (i.e. dog fouling, nappies, needles, syringes, face masks etc.);
- bulky litter (i.e. household appliances, furniture, etc.); and
- miscellaneous litter (i.e. items not covered by the other categories e.g. twine, clothes, fabrics etc.).
6. The initial series of surveys allow local authorities to establish “benchmark” assessments of the extent and composition of litter pollution in their areas; comparison of future survey results with the benchmark surveys will allow progress to be measured. In this way, analysis of survey data will enable each local authority to assess the effectiveness of its litter management strategies on an ongoing basis and ensure the optimum allocation of resources to tackle litter.
7. The data produced by the national monitoring system surveys allow local authorities to gauge:
- the extent and severity of litter pollution in each local authority area;
- the types, most likely sources and causes of litter;
- the changes in litter levels from location to location and over time;
- the location of litter black spots; and
- the impact of new anti-litter measures.
8. Thus, the National Litter Pollution Monitoring System is an environmental management tool that enables local authorities to tackle litter more effectively, by providing a framework for consistent and accurate self-assessment by local authorities “if you can measure the litter problem, you can manage it”.
The 2023 Systems Report can be downloaded in PDF format by clicking here  (7.06mb) (7.06mb)
The 2022 Systems Report can be downloaded in PDF format by clicking here (4.31mb)
The 2021 Systems Report can be downloaded in PDF format by clicking here (4.21mb)
The 2020 Systems Report can be downloaded in PDF format by clicking here (2.88mb)
The 2019 Systems Report can be downloaded in PDF format by clicking here (2.97mb)
The 2018 Systems Report can be downloaded in PDF format by clicking here (2.56mb)
The 2017 Systems Report can be downloaded in PDF format by clicking here (1.38mb)
The 2016 Systems Report can be downloaded in PDF format by clicking here (1.45mb)
The 2015 Systems Report can be downloaded in PDF format by clicking here (6.82mb)
The 2014 Systems Report can be downloaded in PDF format by clicking here (2.84mb)
The 2013 Systems Report can be downloaded in PDF format by clicking here (1.35mb)
The 2012 Systems Report can be downloaded in PDF format by clicking here (1.36mb)
The 2011 Systems Report can be downloaded in PDF format by clicking here (1.36mb)
The 2010 Systems Report can be downloaded in PDF format by clicking here (1.36mb)
The 2009 Systems Report can be downloaded in PDF format by clicking here (1.37mb)
The 2008 Systems Report can be downloaded in PDF format by clicking here (1.01mb)
The 2007 Systems Report can be downloaded in PDF format by clicking here (1.27mb)
The 2006 Systems Report can be downloaded in PDF format by clicking here (1.01mb)
The 2005 Systems Report can be downloaded in PDF format by clicking here (1.01mb)
The 2004 Systems Report can be downloaded in PDF format by clicking here (2.2mb)
The 2003 Annual Report can be downloaded in PDF format by clicking here (2.3mb)
The 2002 Systems Report can be downloaded in PDF format by clicking here (2.3mb)
The 2000/2001 Systems Report can be downloaded in PDF format by clicking here (2.3mb)
The 1999/2000 Systems Report can be downloaded in PDF format by clicking here (2.3mb)
|
 |